Chapter 4: Architecture Design
Typical system topology, reference architectures, and physical device wiring for cybersecurity monitoring deployments
Architecture design is the foundational engineering activity that translates monitoring requirements into a deployable technical solution. A well-designed monitoring architecture must balance completeness of coverage, system performance, operational resilience, and cost efficiency. This chapter presents the canonical reference architectures for cybersecurity monitoring systems, from the logical network topology to the physical device wiring and rack layout. These designs are derived from real-world deployments and represent proven patterns that can be adapted to specific organizational contexts.
4.1 Logical Network Topology
The logical topology of a cybersecurity monitoring system defines the security zones, traffic flows, and monitoring collection points that together provide comprehensive visibility. The reference architecture follows a defense-in-depth model with distinct security zones, each with its own monitoring requirements and data collection strategy. The SIEM platform sits at the center of the monitoring architecture, receiving normalized event data from all zones through dedicated log collection infrastructure.
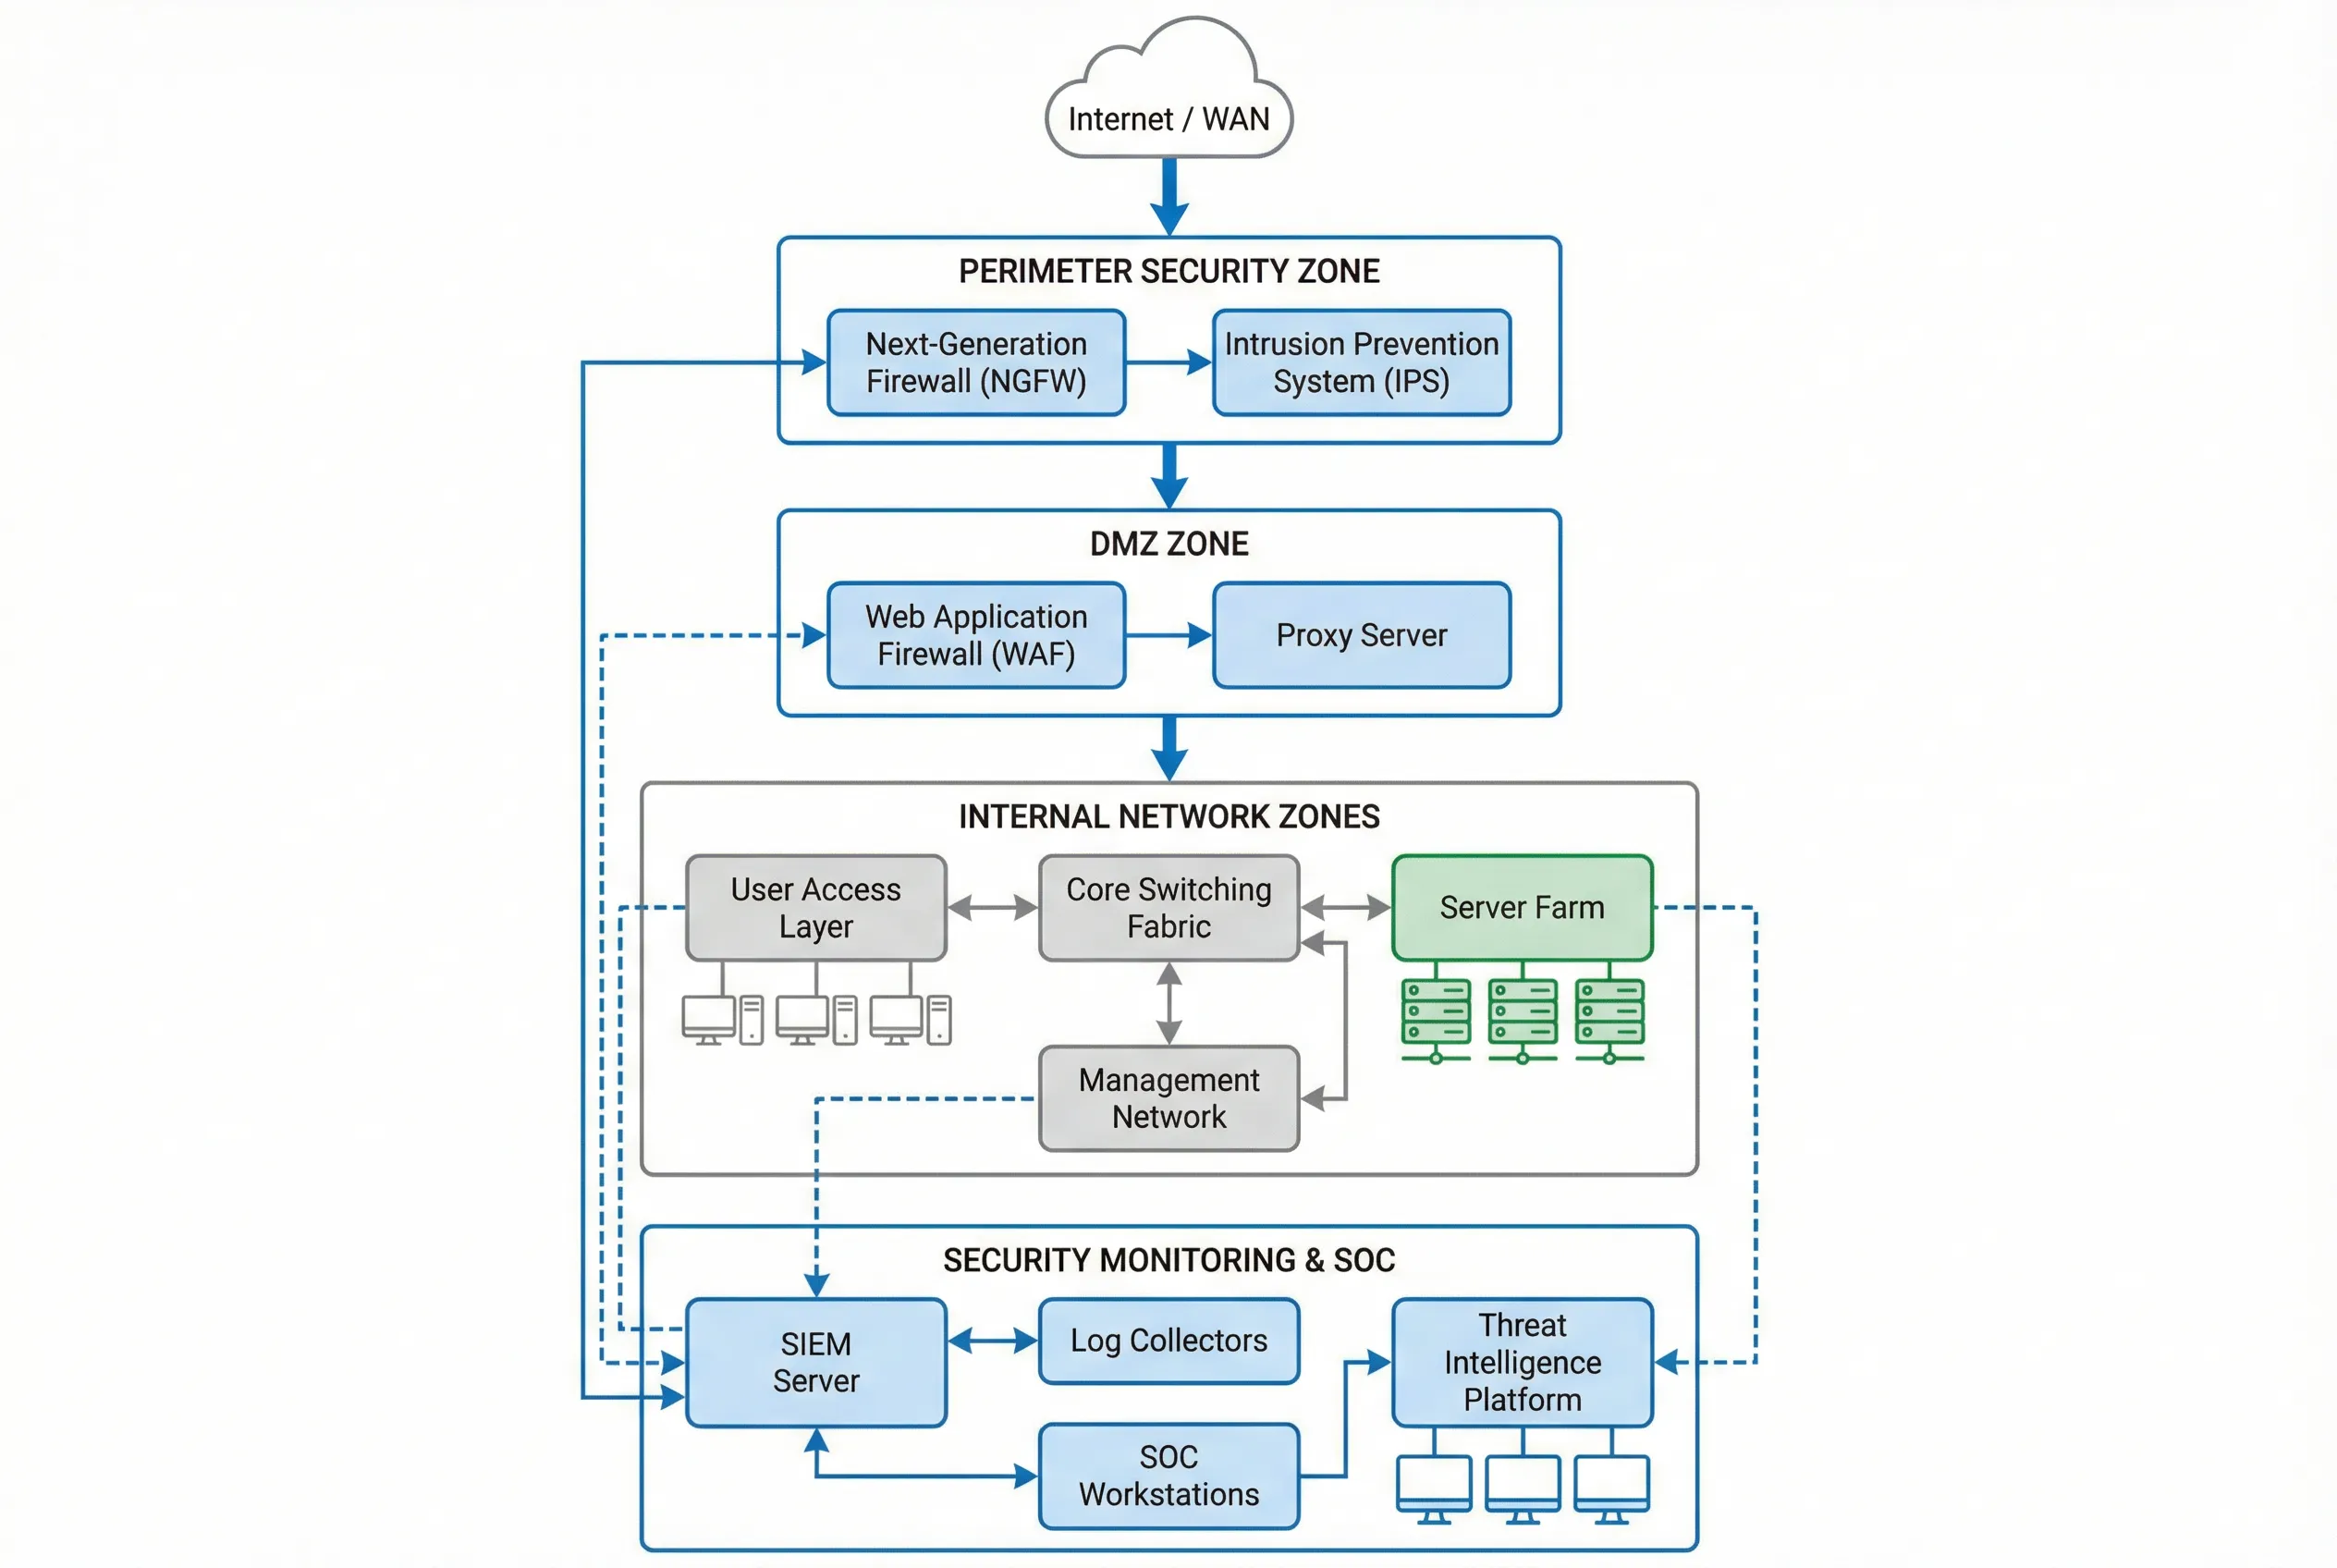
Figure 4.1: Cybersecurity Monitoring System Logical Network Topology — Multi-zone architecture with perimeter security, DMZ, internal network zones, and centralized SIEM with SOC workstations.
The topology is organized into five primary security zones, each with distinct monitoring requirements. The perimeter zone captures all north-south traffic between the organization and the internet, providing the first line of detection for inbound threats and outbound data exfiltration. The DMZ zone monitors traffic to and from publicly accessible services, capturing web application attacks and proxy bypass attempts. The internal network zones require east-west traffic monitoring to detect lateral movement, which is the most critical detection gap in traditional perimeter-focused architectures.
| Security Zone | Primary Devices | Monitoring Method | Key Log Sources | Collection Priority |
|---|---|---|---|---|
| Perimeter Zone | NGFW, IPS, Anti-DDoS | Syslog + SNMP + NetFlow | Firewall allow/deny, IPS alerts, flow records | Critical |
| DMZ Zone | WAF, Reverse Proxy, Load Balancer | Syslog + API + Agent | WAF events, HTTP access logs, SSL inspection | High |
| Core Network | Core Switches, Routers | NetFlow/sFlow + SNMP + Syslog | Flow records, routing changes, interface stats | High |
| Server Farm | Application Servers, DBs, AD | Agent + Syslog + API | OS events, application logs, DB audit, AD events | Critical |
| User Access | Endpoints, VPN, NAC | EDR Agent + Syslog | EDR telemetry, VPN auth, NAC posture | High |
| Management Network | Jump Servers, PAM, OOB | Agent + Syslog | Privileged session logs, admin access, config changes | Critical |
4.2 Physical Device Wiring & Rack Layout
The physical wiring diagram defines the actual cable connections between monitoring components in the data center rack. Proper physical design is critical for ensuring that monitoring traffic does not interfere with production traffic, that management access is isolated on a separate out-of-band network, and that the system can survive individual component failures without losing monitoring coverage. The reference rack layout places all monitoring components in a dedicated security rack with redundant power and cooling.
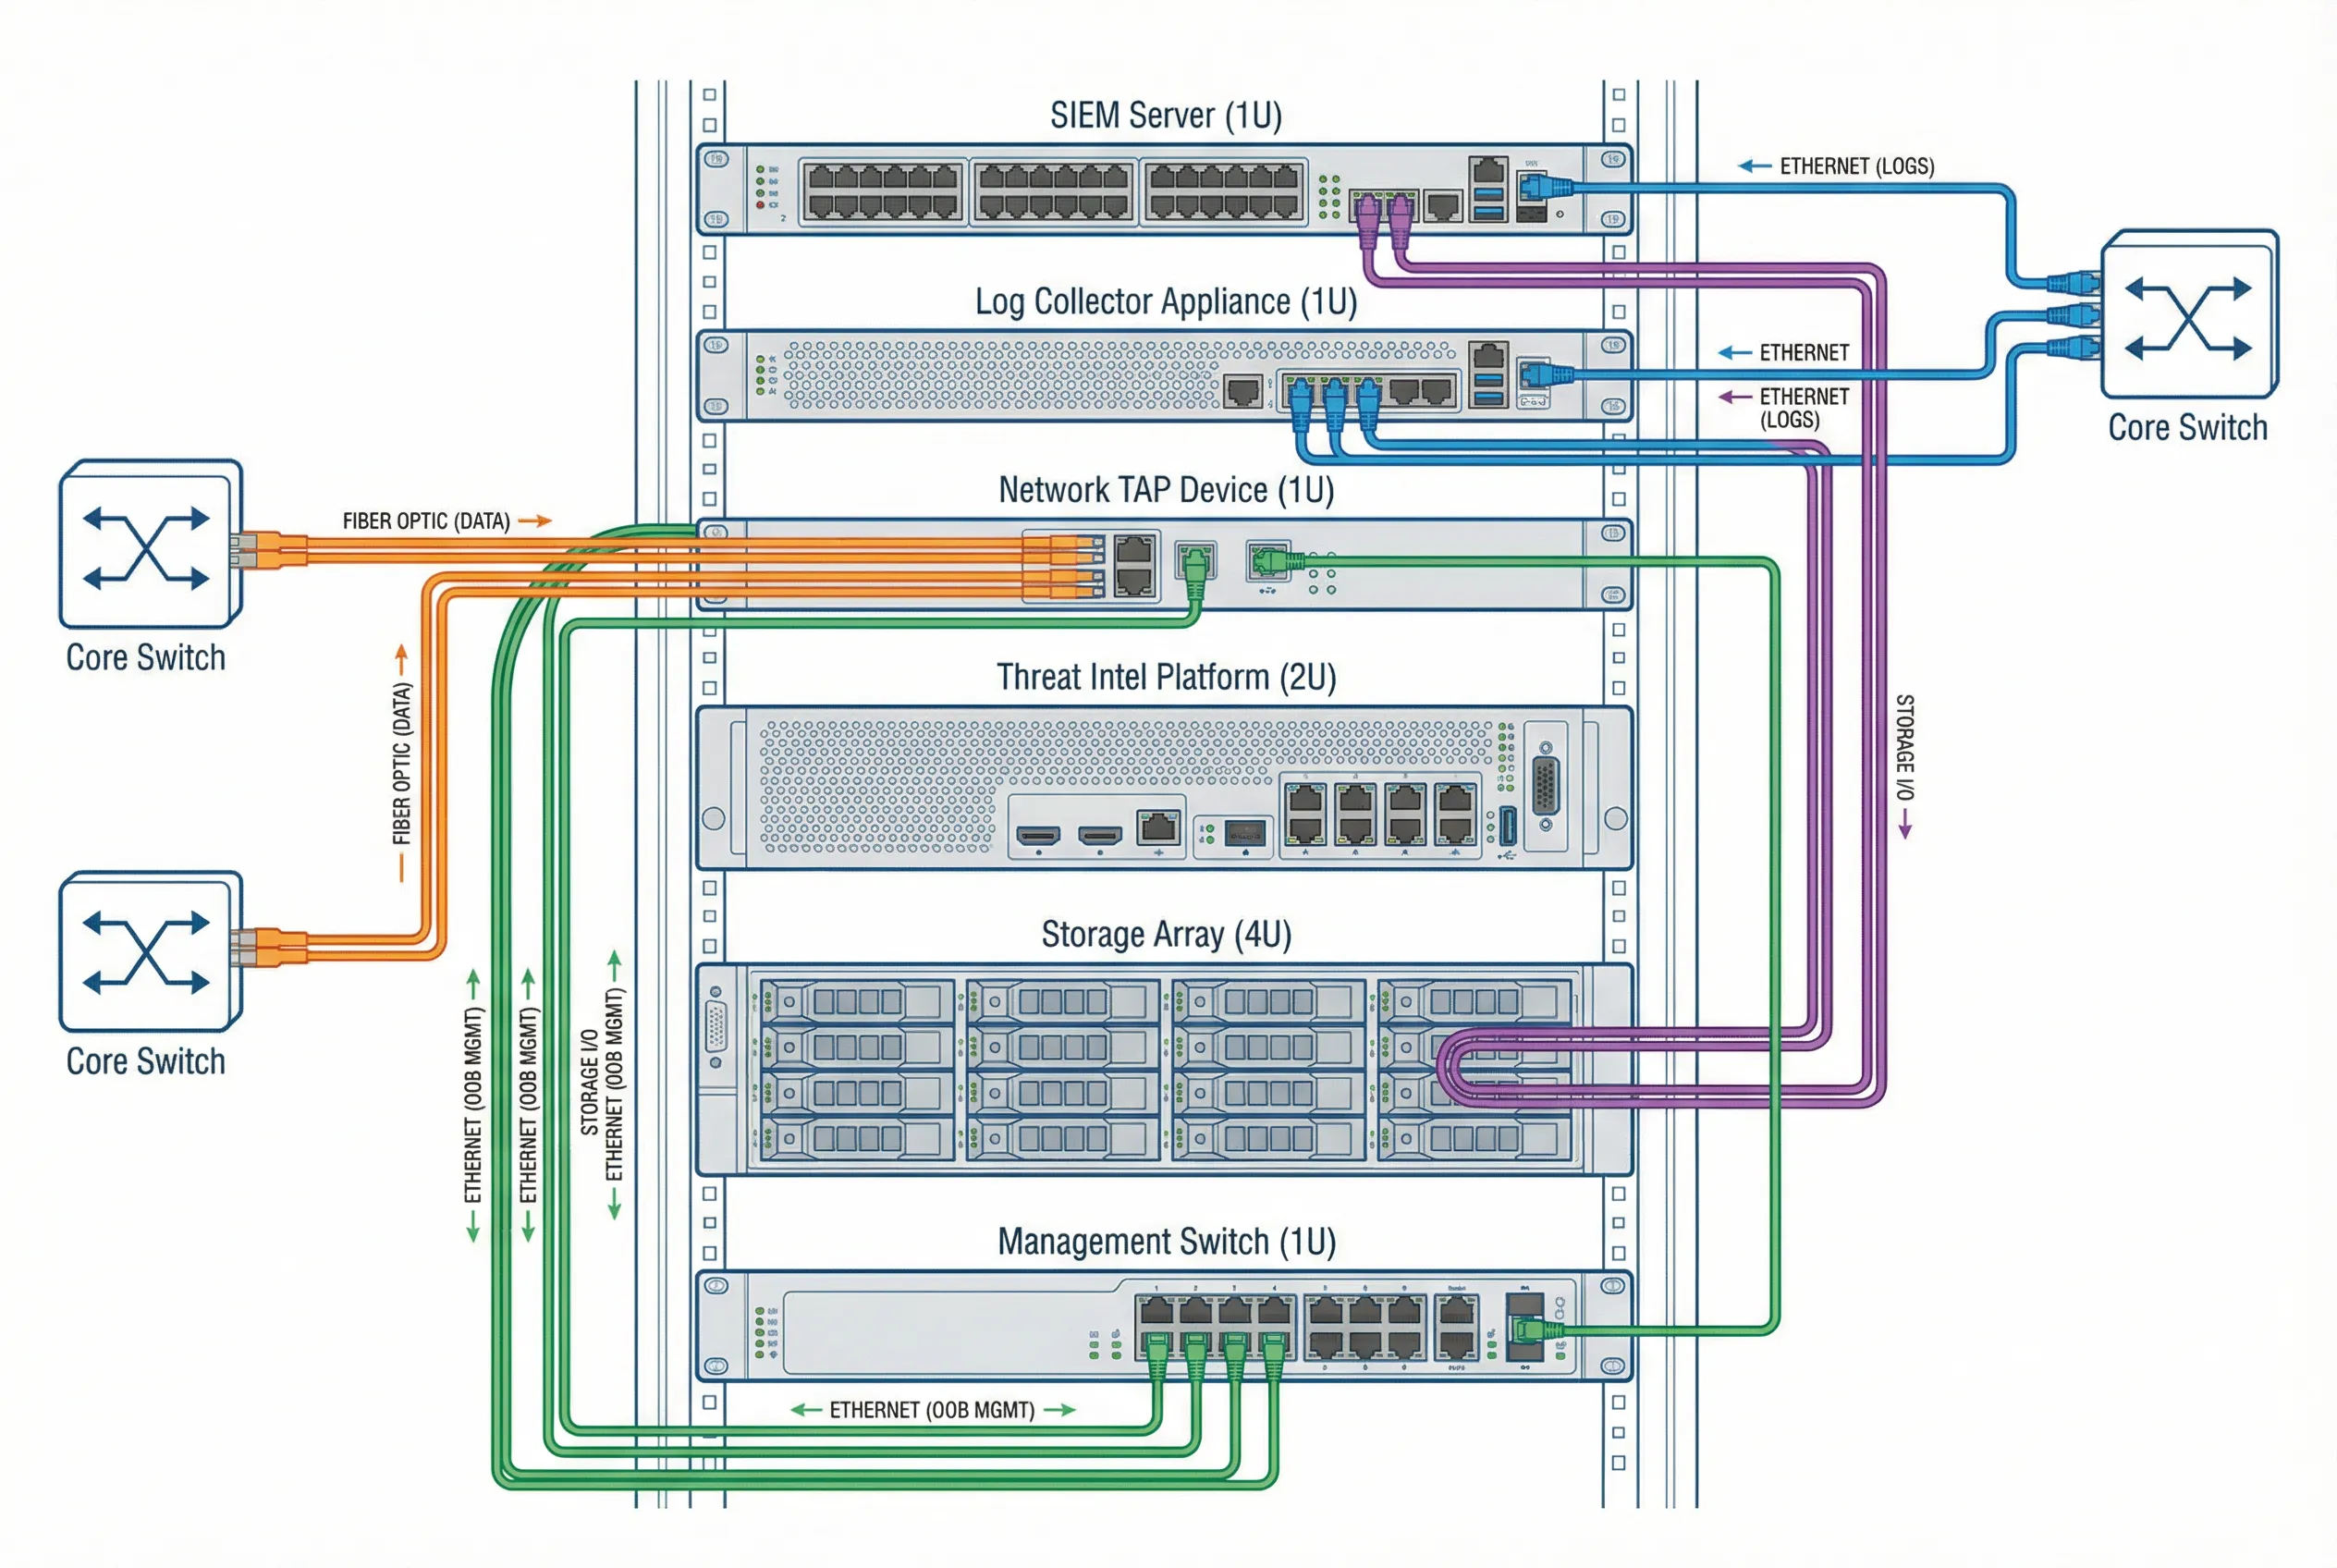
Figure 4.2: Physical Device Wiring and Connection Diagram — Rack-mounted monitoring equipment with color-coded cable connections: fiber optic (orange) for data capture, Ethernet (blue) for log forwarding, management (green) for OOB access, and storage (purple) for data persistence.
The color-coded cable scheme is a critical operational practice that enables rapid troubleshooting and reduces the risk of accidental disconnection. Each cable type serves a distinct function: fiber optic cables carry the high-bandwidth monitoring traffic from network TAPs to the log collector; standard Ethernet cables carry processed log data between components; the out-of-band management network provides secure administrative access that remains available even if the production network is compromised; and storage cables connect the SIEM platform to the storage array for log persistence.
| Cable Type | Color Code | Connection | Bandwidth | Purpose |
|---|---|---|---|---|
| Fiber Optic (Single-mode) | Orange | Core Switch → Network TAP | 10/40/100 Gbps | Passive traffic capture (no packet injection) |
| Ethernet (Cat6A) | Blue | Log Collector → SIEM Server | 1/10 Gbps | Normalized log forwarding |
| Ethernet (Cat6) | Green | All Devices → Management Switch | 1 Gbps | Out-of-band management access |
| iSCSI/FC | Purple | SIEM Server → Storage Array | 16/32 Gbps | Log storage and retrieval |
4.3 High Availability Architecture Patterns
A monitoring system that experiences downtime during an active security incident is a critical failure. High availability design ensures that the monitoring infrastructure remains operational even during component failures, maintenance windows, or capacity overloads. The HA architecture for cybersecurity monitoring systems requires careful consideration of each component's failure modes and the impact of that failure on monitoring coverage.
| Component | HA Pattern | Failover Time | Data Loss on Failover | Complexity |
|---|---|---|---|---|
| SIEM Platform | Active-Passive cluster with shared storage | <60 seconds | None (shared storage) | High |
| Log Collectors | Active-Active load balancing | Immediate | None (in-flight logs re-queued) | Medium |
| Network TAPs | Bypass mode with failopen | Immediate | Monitoring gap during failover | Low |
| Storage Array | RAID 6 + hot spare + remote replication | <5 minutes | None (synchronous replication) | High |
| Threat Intel Platform | Active-Passive with database replication | <120 seconds | None (replicated DB) | Medium |
4.4 Architecture Sizing Guidelines
Proper sizing of the monitoring architecture is essential to ensure that the system can handle peak event volumes without dropping events or introducing unacceptable alert latency. The sizing model is based on the Events Per Second (EPS) metric, which represents the normalized event throughput after parsing and enrichment. The following table provides sizing guidelines for three deployment tiers based on organizational scale.
| Deployment Tier | Organization Size | Peak EPS | Daily Log Volume | SIEM Nodes | Storage (90-day) |
|---|---|---|---|---|---|
| Small | <500 users, 1 site | 500–2,000 EPS | 50–200 GB/day | 1 node (HA pair) | 10–20 TB |
| Medium | 500–5,000 users, 2–5 sites | 2,000–20,000 EPS | 200 GB–2 TB/day | 3–5 nodes | 20–200 TB |
| Large | 5,000–50,000 users, 5–20 sites | 20,000–100,000 EPS | 2–10 TB/day | 5–15 nodes | 200 TB–1 PB |
| Enterprise | >50,000 users, global | 100,000+ EPS | 10+ TB/day | 15+ nodes (distributed) | 1 PB+ |