Chapter 12: Operations & Maintenance
Daily SOC operations, preventive maintenance schedules, performance monitoring, and continuous improvement frameworks for cybersecurity monitoring systems
A cybersecurity monitoring system is not a set-and-forget deployment. The threat landscape evolves continuously, new attack techniques emerge, and the monitored environment changes as new systems are added, configurations are modified, and business processes evolve. Effective operations and maintenance requires a structured program of daily operational activities, periodic maintenance tasks, performance monitoring, and continuous improvement initiatives. This chapter defines the operational framework for maintaining a cybersecurity monitoring system at peak effectiveness throughout its operational lifecycle.
12.1 Security Operations Center in Action
The following image illustrates a mature Security Operations Center (SOC) during active operations, demonstrating the integration of people, processes, and technology that characterizes an effective monitoring program. Key elements include the video wall for situational awareness, analyst workstations with multi-monitor setups, incident response playbook documentation, and real-time performance metrics visible across the environment.
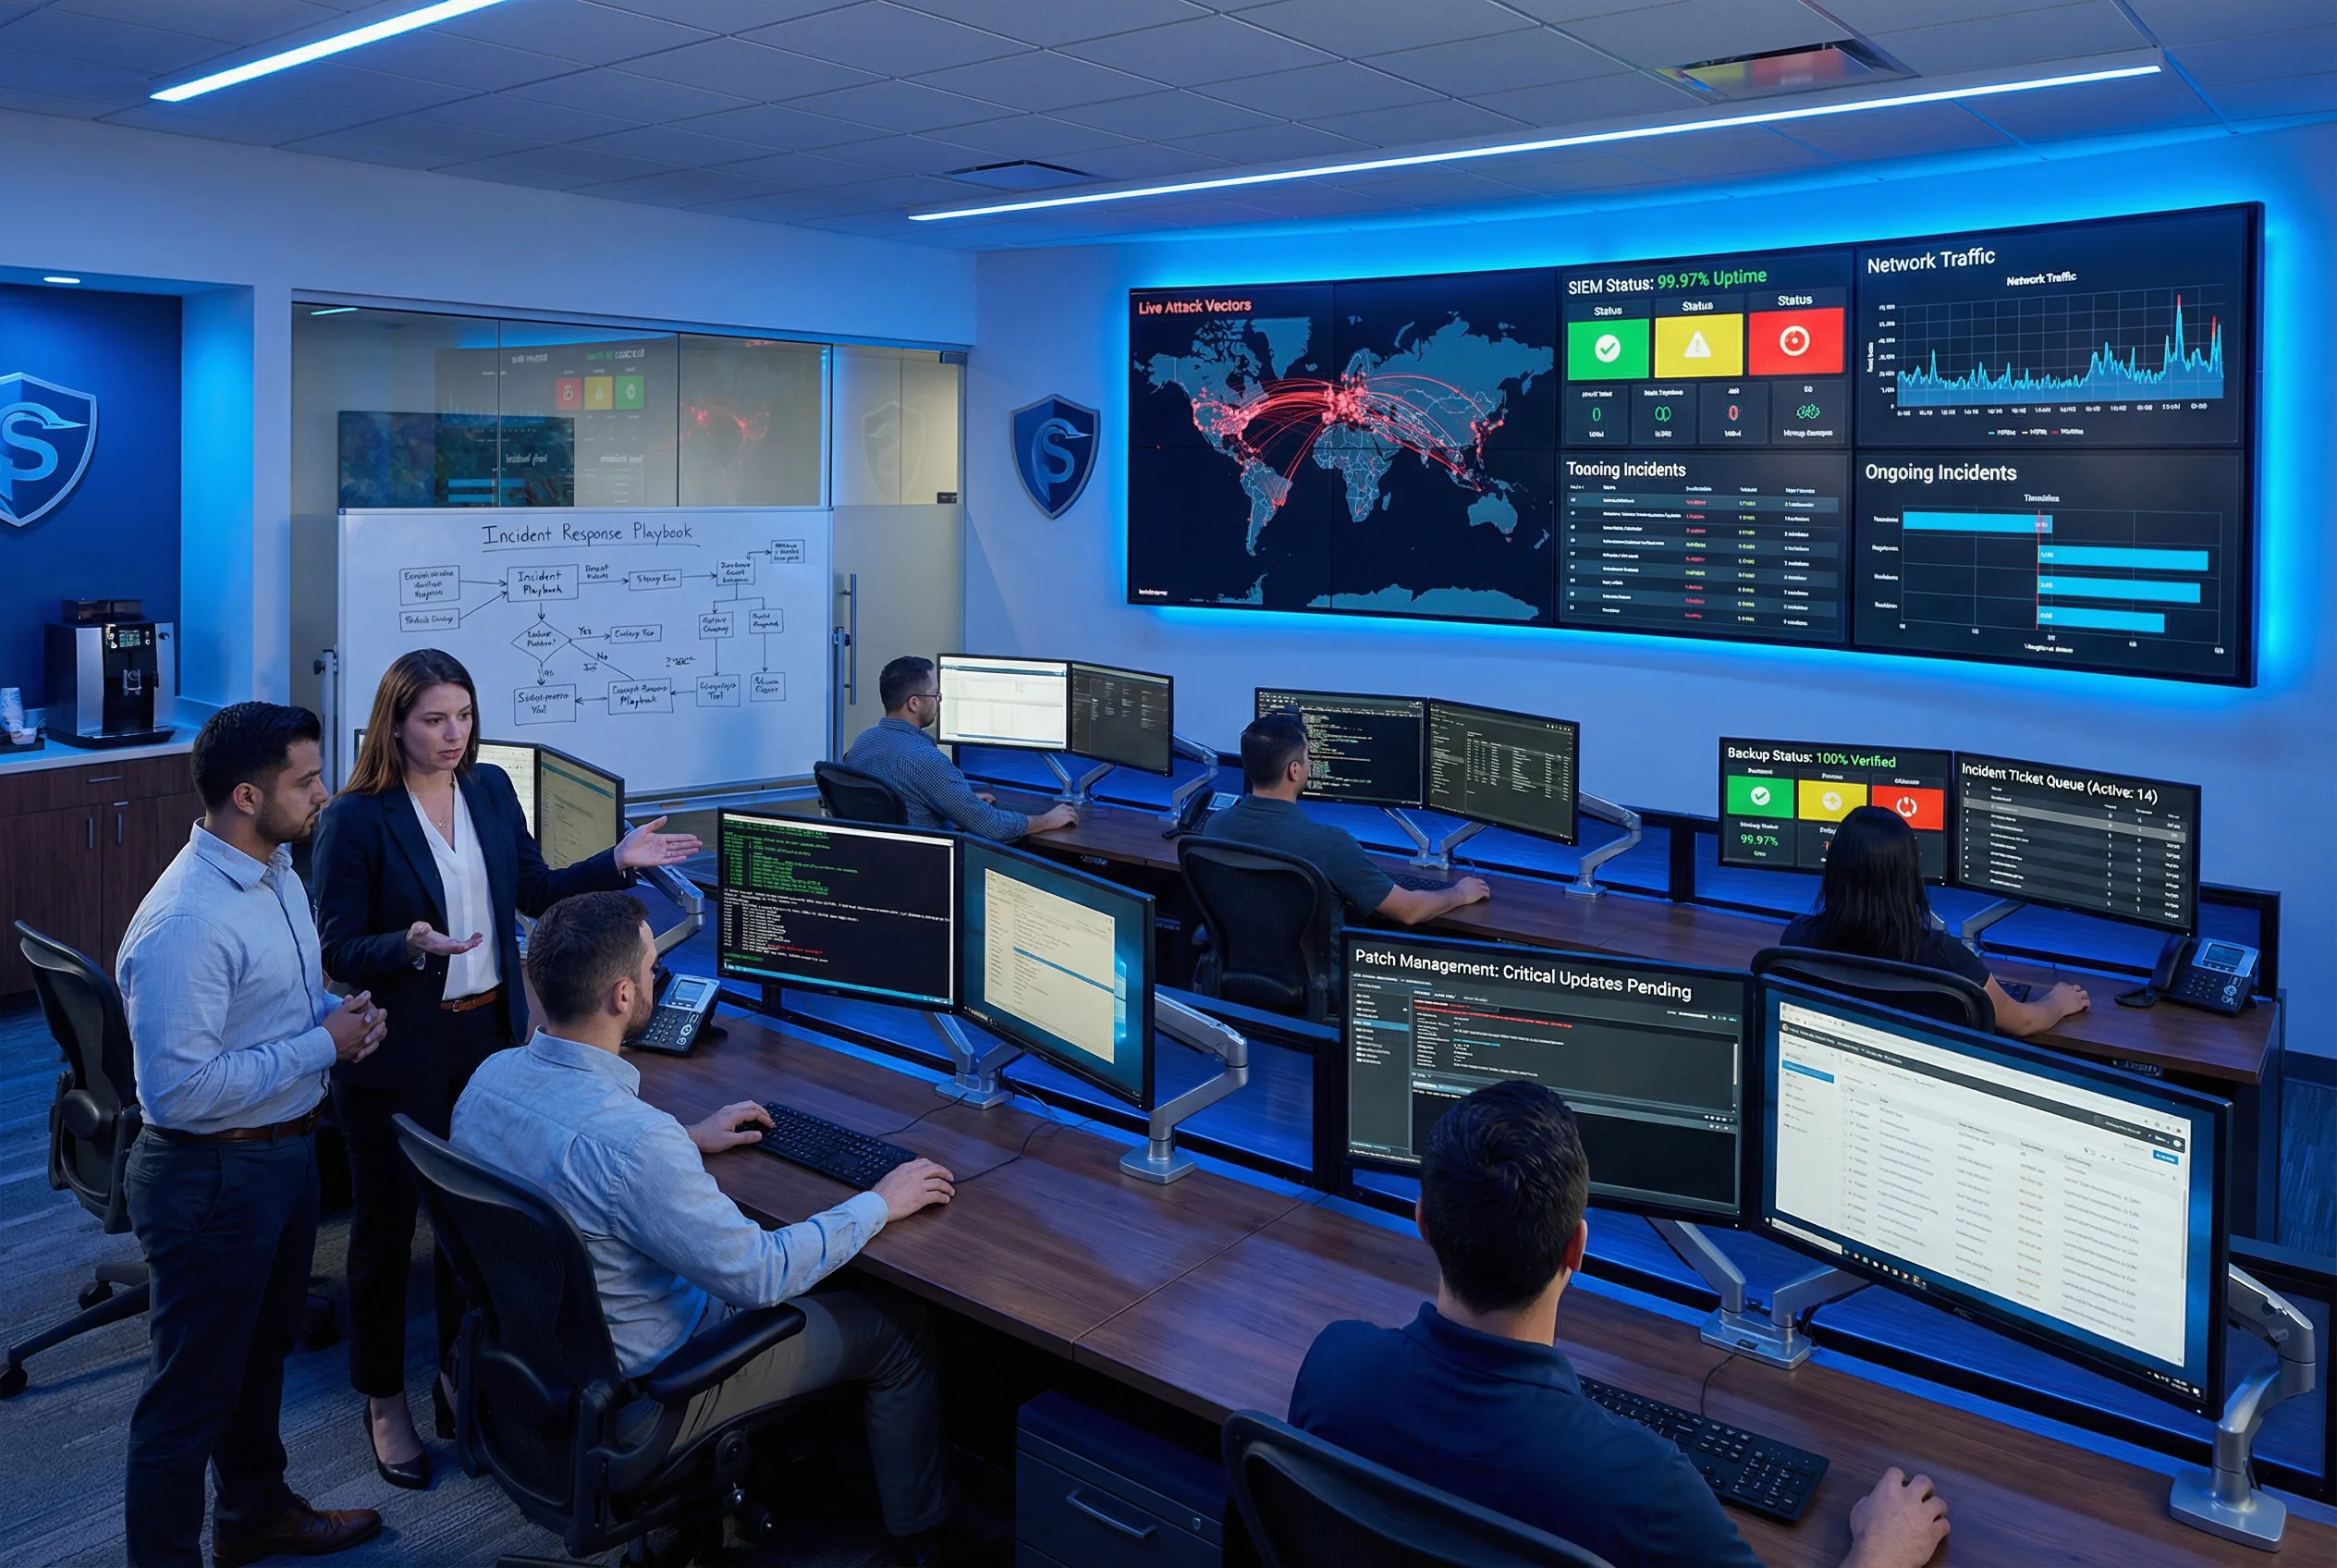
Figure 12.1: Security Operations Center in Action — A mature SOC environment showing: global threat map on the video wall with live attack vectors, SIEM status dashboard showing 99.97% uptime, network traffic graphs, incident response playbook on whiteboard, analyst workstations with multi-monitor setups, patch management console, backup status indicators, and incident ticket queue. The SOC team collaborates on active incident response while maintaining continuous monitoring coverage.
12.2 Daily Operations Checklist
The daily operations checklist defines the minimum set of activities that must be performed each day to ensure the monitoring system is operating correctly and all security events are being properly processed. These activities should be performed at the start of each shift and documented in the SOC shift log.
| Activity | Frequency | Responsible Role | Time Required | Documentation |
|---|---|---|---|---|
| Review SIEM health dashboard: EPS, queue depth, storage utilization, node status | Daily (start of shift) | SOC Analyst | 10 min | Shift log entry |
| Verify all log sources are active and sending events (check for silent sources) | Daily | SOC Analyst | 15 min | Log source health report |
| Review and triage all open alerts from previous 24 hours | Daily | SOC Analyst / Tier 2 | 60–120 min | Alert disposition in ticketing system |
| Review threat intelligence feed health; check for expired or failed feeds | Daily | SOC Analyst | 10 min | TI feed health log |
| Check backup job status for SIEM configuration and log data | Daily | SOC Analyst | 5 min | Backup status log |
| Review patch management console for critical security patches pending | Daily | Security Engineer | 15 min | Patch status report |
| Update incident tickets with investigation progress; escalate as required | Daily | SOC Analyst / Tier 2 | 30 min | Ticket updates in ITSM |
12.3 Preventive Maintenance Schedule
Preventive maintenance activities are essential to prevent performance degradation, ensure data integrity, and maintain the security of the monitoring infrastructure itself. The following maintenance schedule defines the required activities, their frequency, and the estimated effort for each task. All maintenance activities should be scheduled during low-traffic periods and communicated to the SOC team in advance.
| Maintenance Activity | Frequency | Effort | Impact |
|---|---|---|---|
| OS and application security patch review and testing | Monthly | 4–8 hrs | Maintenance window required for critical patches |
| Detection rule review: tune false positives, add new rules for emerging threats | Monthly | 4–8 hrs | No downtime required |
| Threat intelligence feed review: add/remove feeds, validate IOC quality | Monthly | 2–4 hrs | No downtime required |
| Storage capacity review and archiving of old log data to cold storage | Monthly | 2–4 hrs | No downtime; background archiving |
| User access review: verify all accounts are active and properly privileged | Quarterly | 2–4 hrs | No downtime required |
| Detection coverage gap analysis against MITRE ATT&CK framework | Quarterly | 8–16 hrs | No downtime required |
| Purple team exercise: simulate adversary techniques to validate detection | Quarterly | 16–40 hrs | Coordination with IT required; no downtime |
| HA failover test: simulate primary component failure; verify failover | Semi-annual | 4–8 hrs | Maintenance window required; brief service interruption |
| Disaster recovery test: restore SIEM from backup in DR environment | Annual | 16–40 hrs | DR environment only; no production impact |
| Full architecture review: assess capacity, coverage, and technology currency | Annual | 40–80 hrs | No downtime; planning activity |
12.4 Key Performance Indicators (KPIs)
Measuring the effectiveness of the cybersecurity monitoring program requires a defined set of key performance indicators that are tracked consistently over time. The following KPIs provide a balanced view of operational efficiency, detection effectiveness, and program maturity. KPI targets should be reviewed annually and adjusted based on organizational risk tolerance and industry benchmarks.
| KPI | Definition | Target | Measurement Frequency |
|---|---|---|---|
| Mean Time to Detect (MTTD) | Average time from initial attack activity to first SIEM alert | <24 hours | Monthly |
| Mean Time to Respond (MTTR) | Average time from alert generation to incident containment | <4 hours (critical); <24 hours (high) | Monthly |
| Alert False Positive Rate | Percentage of alerts that are determined to be false positives after triage | <30% | Weekly |
| Log Source Coverage | Percentage of defined log sources actively sending events | >99% | Daily |
| MITRE ATT&CK Coverage | Percentage of MITRE ATT&CK techniques with at least one detection rule | >75% | Quarterly |
| System Availability | Percentage of time SIEM is fully operational and accepting events | >99.9% | Monthly |
| Event Loss Rate | Percentage of expected events that are not received by the SIEM | <0.01% | Daily |
| Analyst Alert Backlog | Number of alerts older than 24 hours awaiting triage | 0 (zero backlog) | Daily |