Chapter 1: System Components
Architecture, modules, data flows, boundaries, and working principles of the cybersecurity monitoring system
1.1 System Architecture
The cybersecurity monitoring system architecture is organized around three fundamental deployment zones that define both the physical and logical boundaries of the monitoring capability. Understanding these zones and the data flows between them is essential for correct deployment, capacity planning, and operational governance. The architecture must remain consistent whether the underlying SIEM is cloud-native or on-premises, as the interface contracts between zones remain the same.
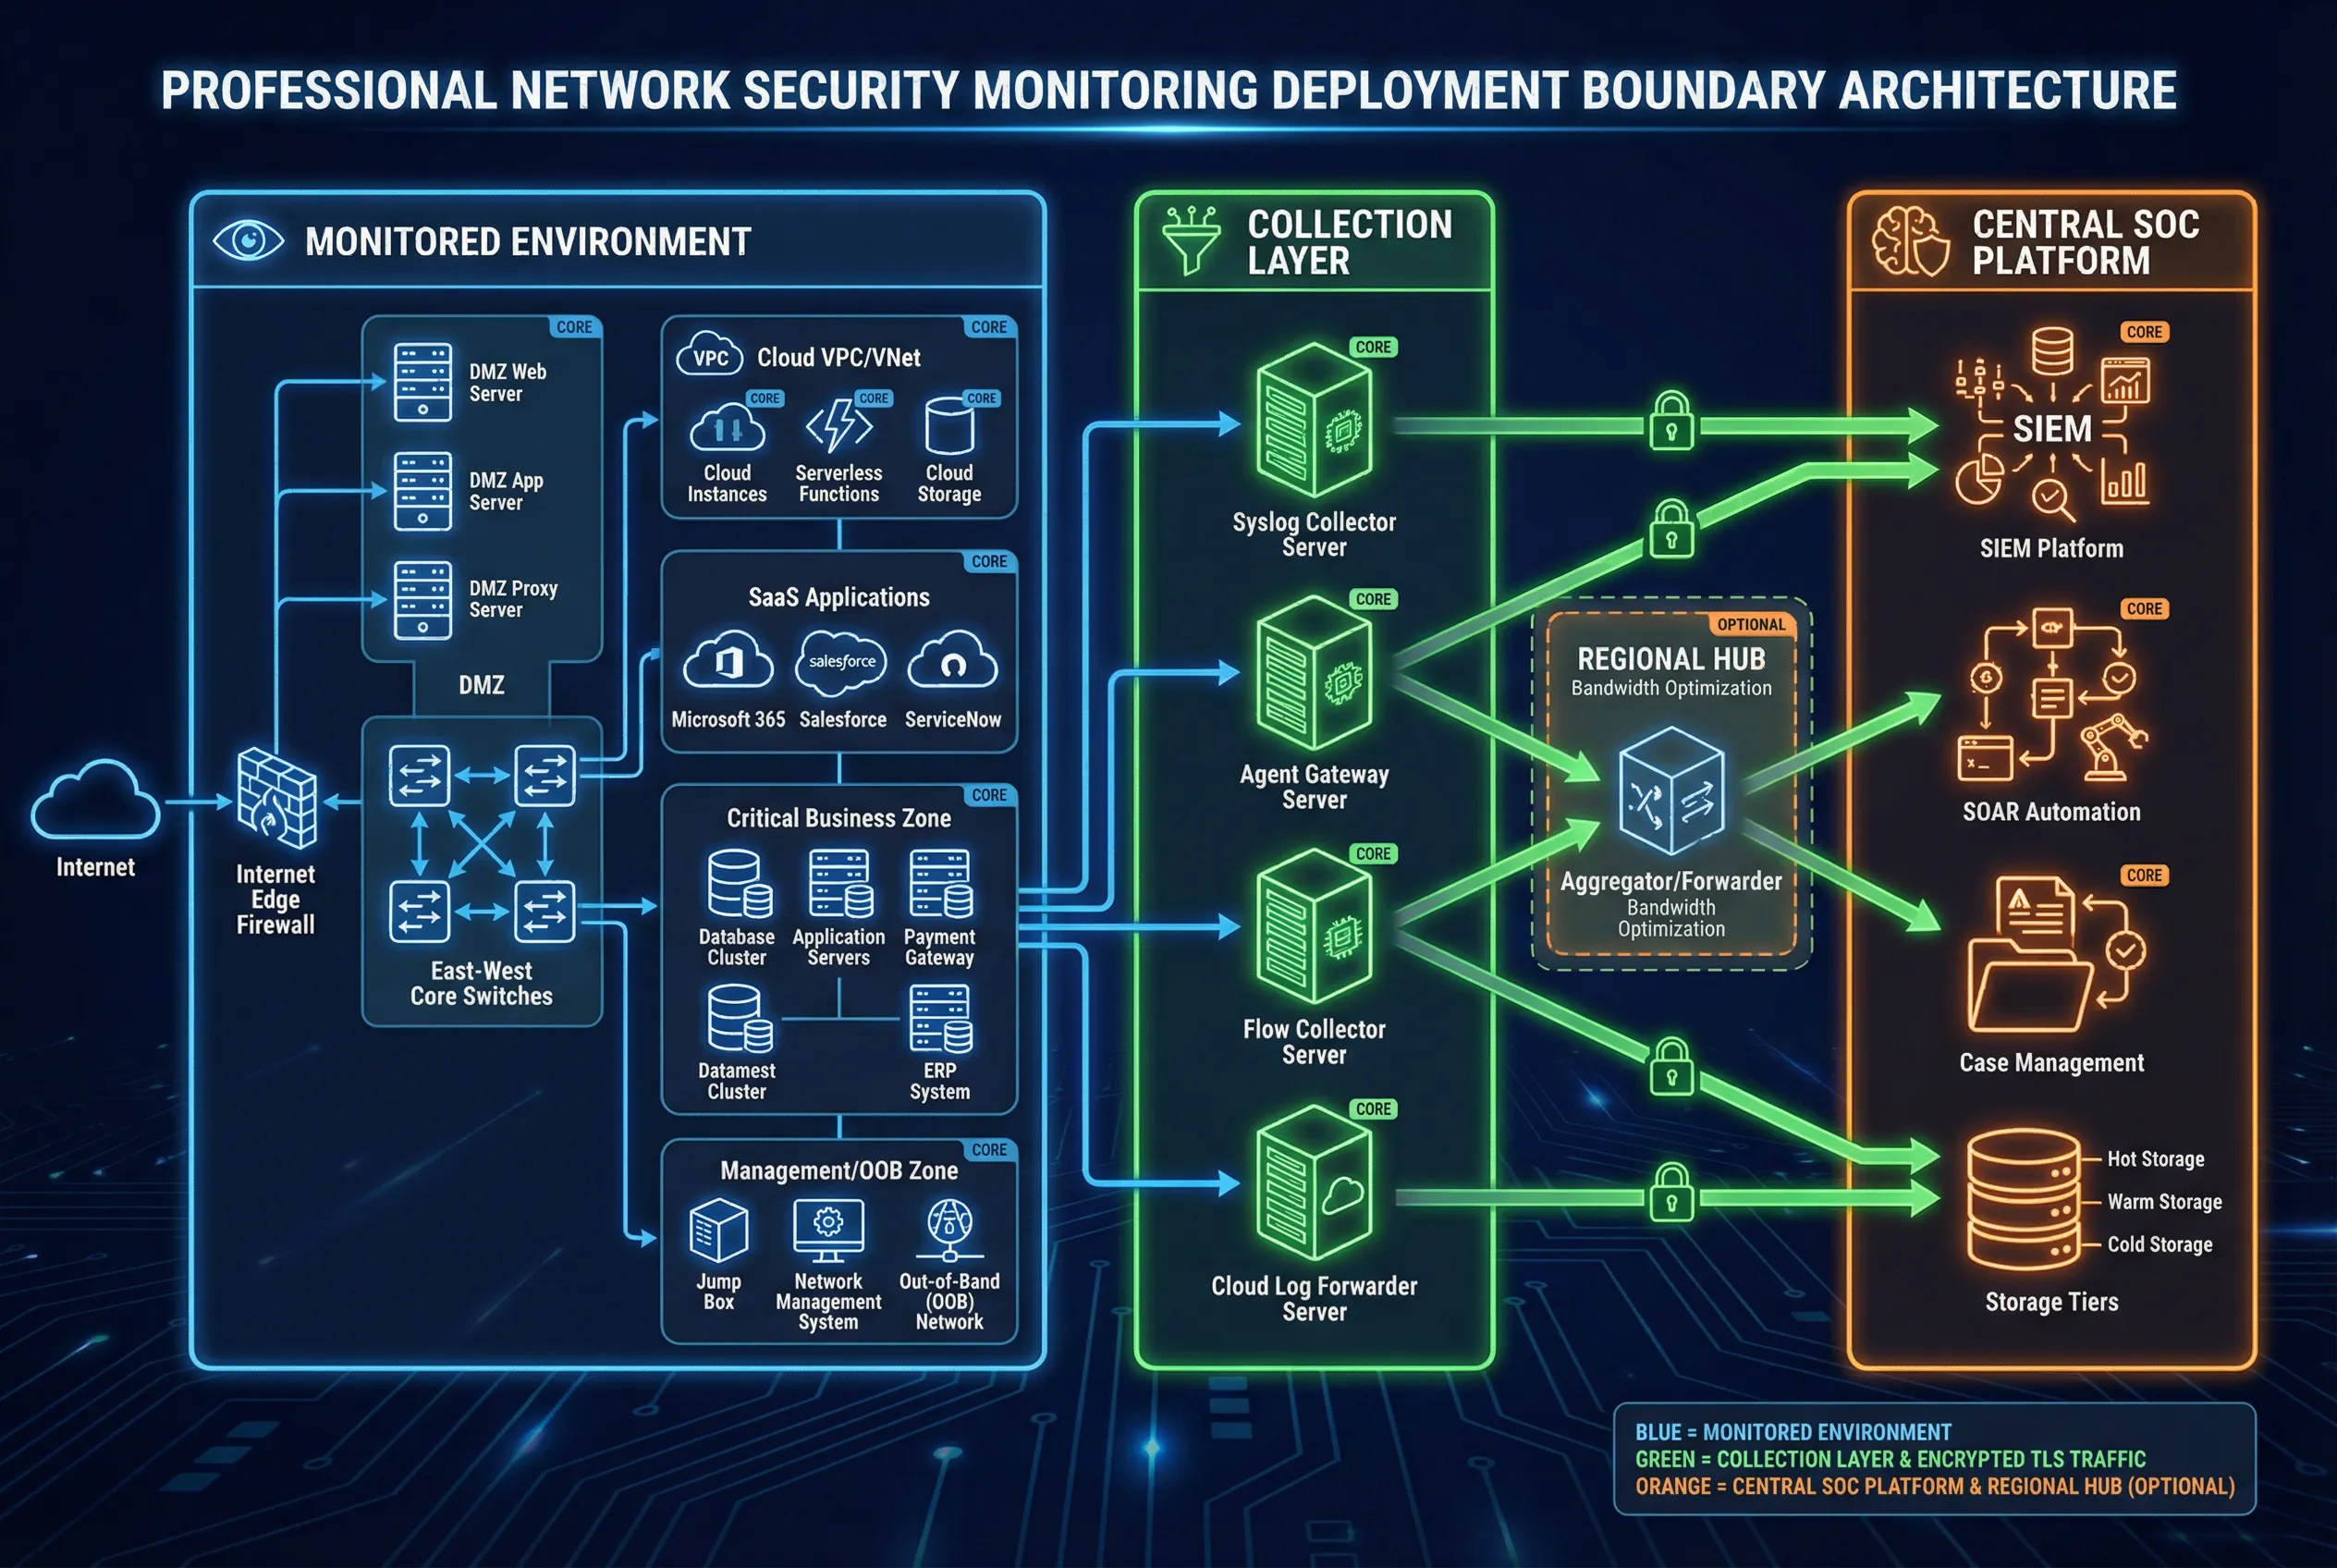
Zone A, the Monitored Environment, encompasses all observation points where security-relevant telemetry originates. This includes the Internet edge with dual firewalls and WAF, the DMZ hosting externally accessible services, the east-west core network carrying internal traffic, the critical business zone containing high-value assets, the management and out-of-band (OOB) network, cloud VPC/VNet environments, and SaaS platforms. Each observation point generates different telemetry types with different criticality levels, and the monitoring architecture must account for this diversity.
Zone B, the Collection Layer, serves as the telemetry aggregation and forwarding tier. Site-local collectors receive raw telemetry from observation points, apply initial buffering and protocol normalization, and forward events securely to the central platform. The collection layer must be designed for high availability, with active-active collector pairs and disk spooling to survive WAN outages without data loss. An optional Regional Hub can be deployed between Zone B and Zone C to optimize bandwidth utilization across geographically distributed sites.
Zone C, the Central SOC Platform, hosts the SIEM ingestion pipeline, analytics and detection engines, SOAR orchestration, case management, and tiered storage. This zone must be hardened, access-controlled, and monitored independently — the monitoring system must itself be monitored. The separation between data plane and management plane within Zone C is a critical security control.
Core Modules
- Sensors/Telemetry Emitters: Network devices, servers, endpoints, and cloud services that generate security-relevant events. These are not deployed by the monitoring system but must be configured to export telemetry in supported formats.
- Collectors/Forwarders: Dedicated components with buffering and TLS-encrypted forwarding. Must support multi-protocol ingestion (syslog, IPFIX, agent API, cloud API) and maintain disk spool for WAN resilience.
- SIEM Ingestion Pipeline: Parse, normalize, and enrich incoming events. Must scale horizontally and maintain parse success rates above 98% for key sources.
- Detection Content: Correlation rules, behavioral analytics baselines, threat intelligence matching, and anomaly detection models. Must be version-controlled and deployed via canary rollout.
- Case Management + ITSM Integration: Converts alerts into tracked incidents with SLA timers, approval workflows, and audit trails.
- Evidence Storage: Tiered hot/warm/archive storage with WORM immutability for critical logs. Retention periods must align with regulatory requirements.
- RBAC, Audit Logging, and Admin Monitoring: Least-privilege access control with full audit trails for all administrative actions, including rule changes, playbook modifications, and data access.
Optional Modules
- Full Packet Capture (PCAP): For select high-value network segments only. Requires significant storage and careful legal/privacy review.
- UEBA/Behavior Analytics Engine: User and entity behavior analytics for insider threat and compromised account detection.
- Deception (Honeypots): Early detection of lateral movement and reconnaissance through decoy assets.
- Sandbox/Detonation: Dynamic analysis of suspicious files and URLs to generate behavioral indicators.
- Attack Surface Monitoring: External exposure tracking to correlate internal events with externally visible vulnerabilities.
1.2 Components & Functions
Each component in the monitoring architecture has a precisely defined responsibility, set of inputs and outputs, key performance indicators, and common mismatch risks. Understanding these specifications is critical for procurement, integration design, and acceptance testing. The component inventory diagram below illustrates the layered stack from telemetry sources through governance.
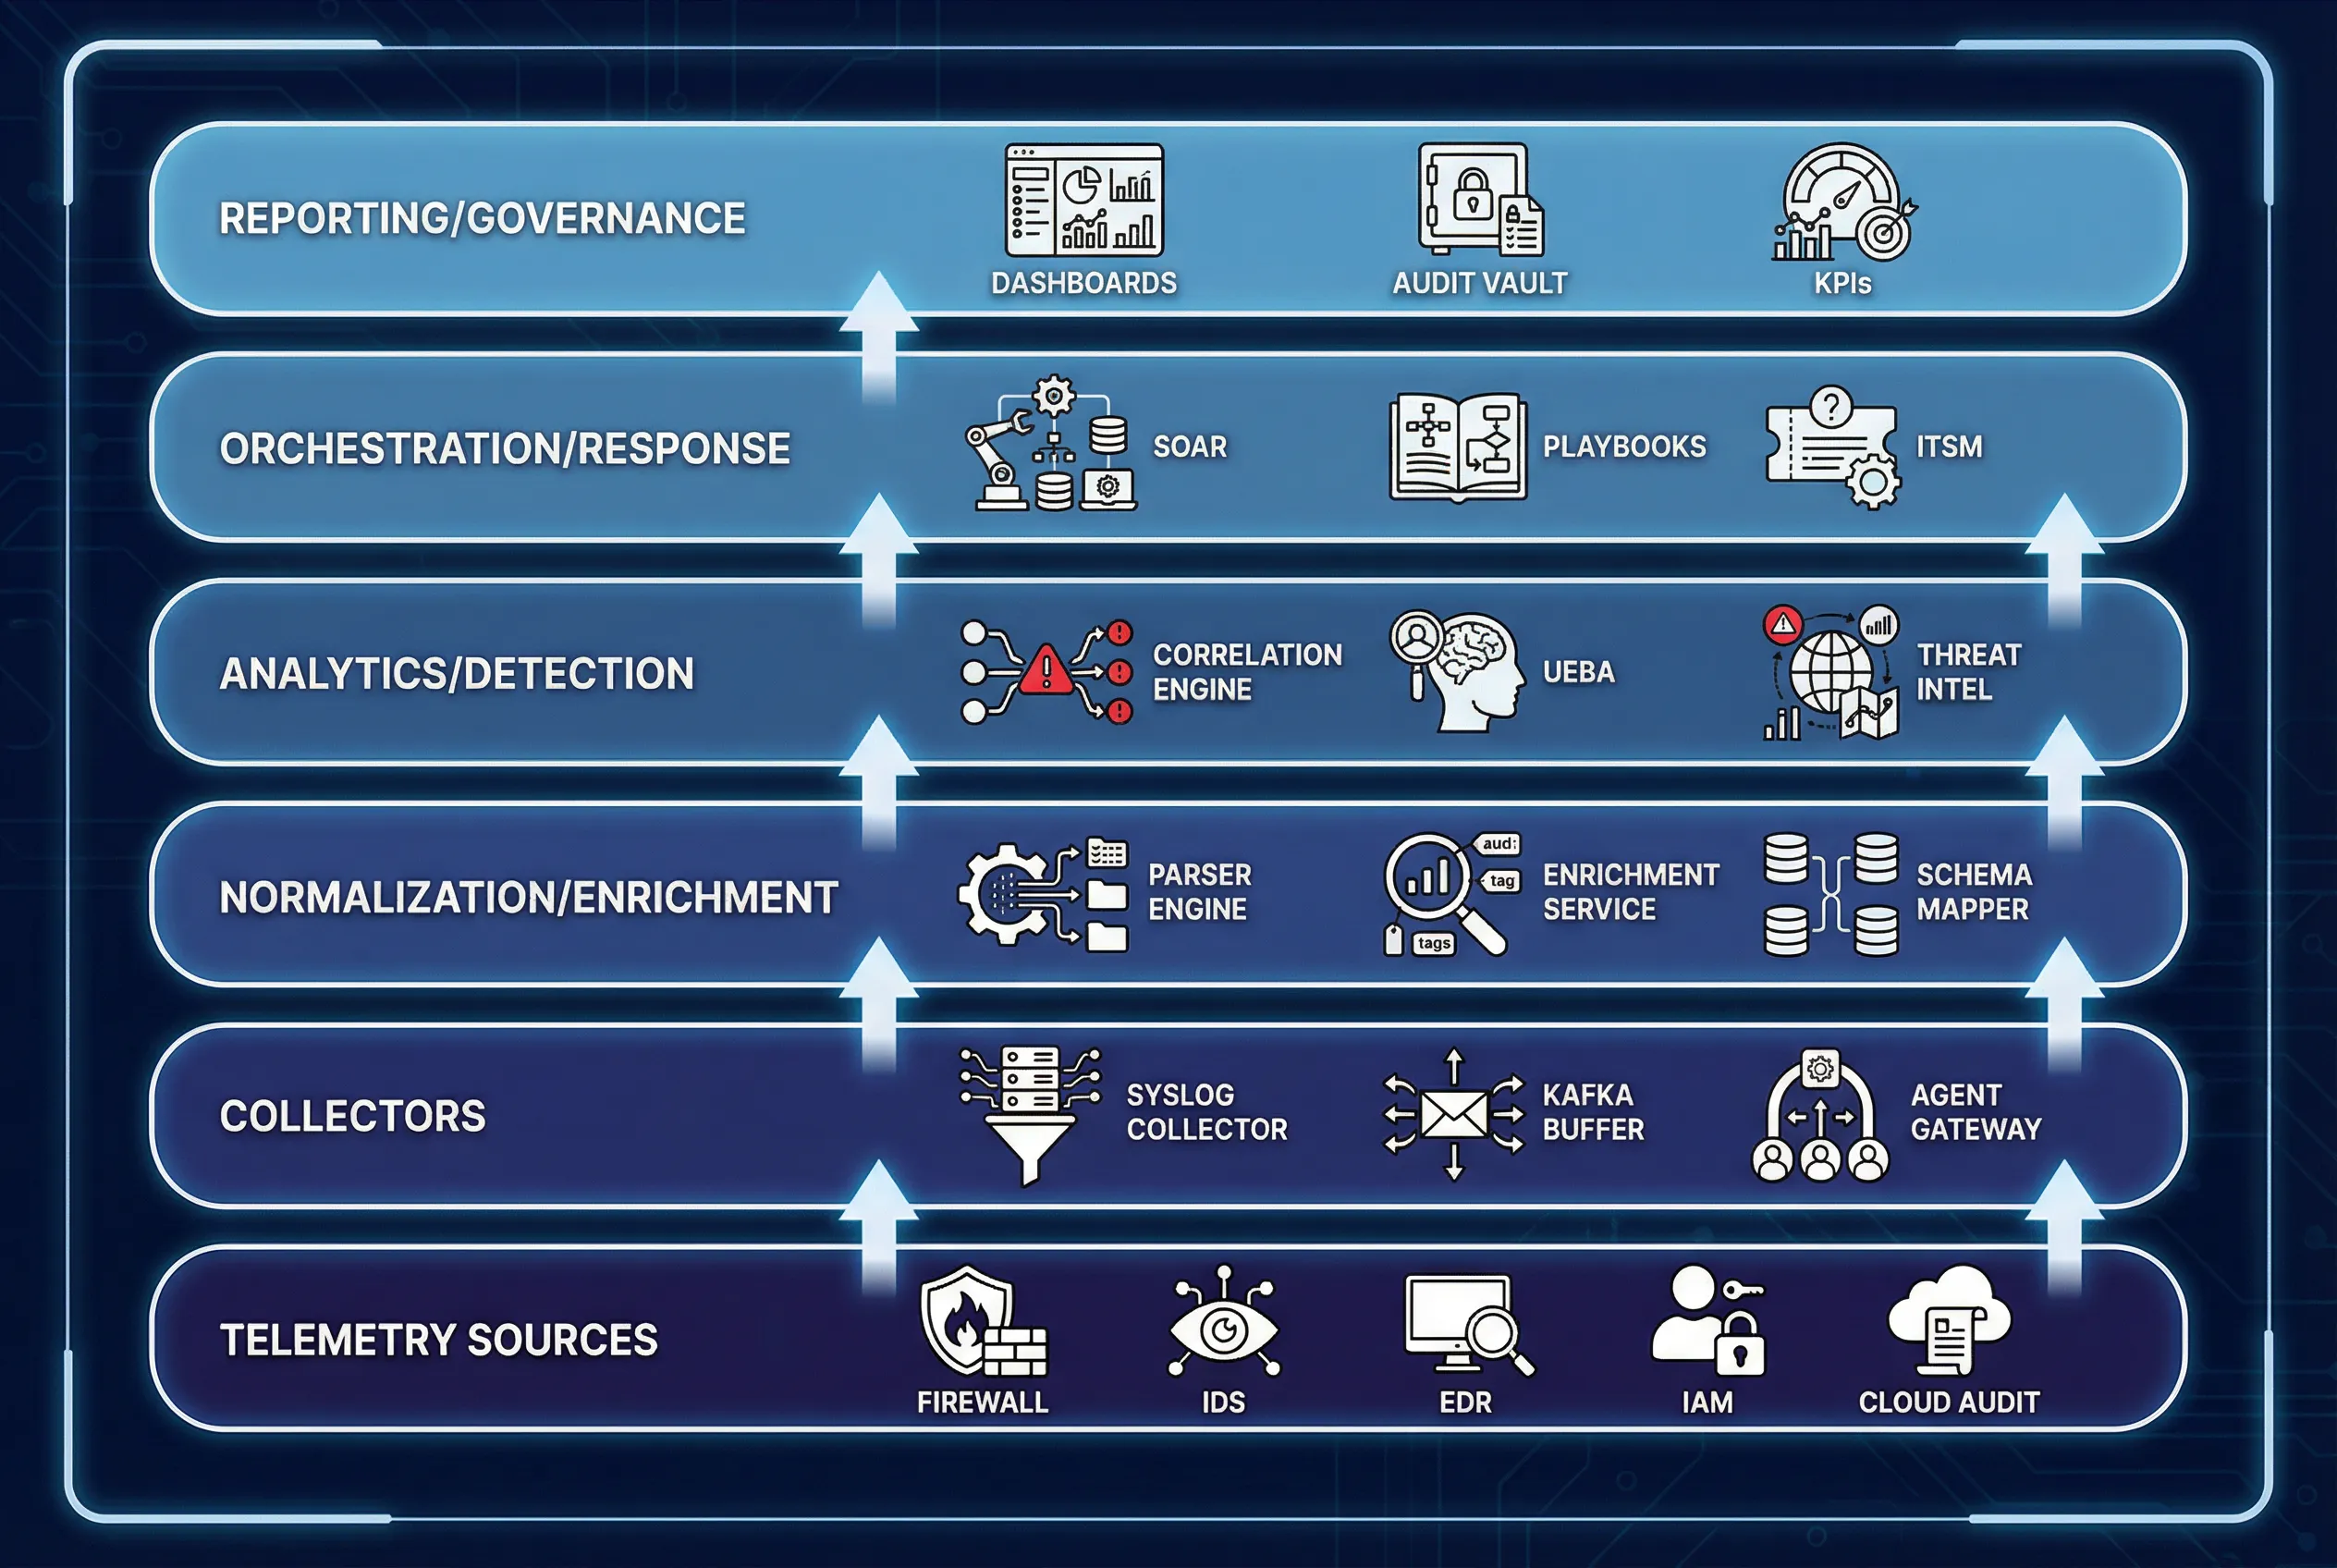
The component specification table below provides a structured reference for each major system component, covering primary responsibilities, inputs, outputs, key performance indicators, and the most common mismatch risks encountered in real deployments. A critical insight from operational experience is that a best-in-class SIEM fails if asset identity binding is poor, and a high-EPS license fails if log quality is unparsed, unsynchronized, and unactionable.
| Component | Primary Responsibility | Inputs | Outputs | Key KPIs | Common Mismatch Risk |
|---|---|---|---|---|---|
| Syslog Collector | Receive, buffer, forward logs | Syslog TCP/UDP | Parsed events / forward stream | Loss <1%, queue depth | UDP loss, no disk buffer |
| Endpoint Agent / EDR Connector | Host telemetry + detections | OS events, EDR alerts | Normalized host events | Coverage %, CPU impact | Agent not allowed / legacy OS |
| Flow Collector (NetFlow/IPFIX) | Network visibility at scale | Flow exports | Flow records | Flow completeness | Wrong sampling, exporter overload |
| Cloud Log Forwarder | Audit trails + service logs | Cloud APIs | Normalized cloud events | API lag, retry success | Rate limit, missing regions |
| SIEM Ingestion Pipeline | Parse, schema, routing | Raw events | Enriched events | Parse success %, latency | Bad parsers → noisy fields |
| Enrichment Service | Asset/user context | CMDB / IAM / Vuln data | Enriched metadata | Match rate | Stale CMDB → wrong owner |
| Correlation Engine | Multi-step detections | Enriched events | Alerts / cases | FPR, detection latency | Over-broad rules |
| SOAR / ITSM Integration | Automated actions | Alerts / cases | Actions, tickets | MTTR, closure rate | No approvals / rollback |
| Evidence Vault (WORM) | Integrity retention | Case artifacts | Immutable records | Integrity checks | No immutability → audit failure |
1.3 Working Principles
The monitoring system operates through a well-defined lifecycle that begins with startup validation, transitions to steady-state continuous monitoring, and includes specific exception handling procedures for the most common failure modes. Understanding these operational principles is essential for both initial deployment and long-term operational stability.
Startup Sequence
- Confirm NTP synchronization across all sources, collectors, and SIEM components. Verify drift is within the 2-second correlation threshold.
- Validate network paths and TLS certificates for all forwarding connections. Confirm port reachability and certificate validity periods.
- Enable parsers and schema mappings; run sample replay tests against known-good event corpora to verify field extraction accuracy.
- Load detection content baseline; enable severity model and verify alert routing to appropriate SOC queues.
- Connect SOAR/ITSM; test "dry-run" actions with approval gates to verify playbook logic without executing containment actions.
Steady-State Operation
During steady-state operation, collectors continuously buffer and forward telemetry to the SIEM. The normalization and enrichment pipeline processes incoming events in near real-time, binding asset and identity context to each event. The detection engine evaluates enriched events against correlation rules, behavioral baselines, and threat intelligence indicators. Alerts that meet severity thresholds are routed to SOC analyst queues for triage. Confirmed incidents trigger SOAR playbooks that execute response actions with appropriate approval gates. Closure of each incident produces lessons learned and tuning tasks that feed back into the detection content and enrichment data.
Exception Handling
Three critical exception chains represent the most common failure modes in production monitoring environments. Each has a defined detection mechanism, behavioral impact, and recovery procedure.
| Exception Chain | Trigger | Symptom | Behavioral Impact | Handling Procedure |
|---|---|---|---|---|
| A — Time Drift | NTP failure or misconfiguration | Impossible event sequences, missing correlation joins | SIEM correlation confidence drops; false negatives increase | Alert on drift >2s; enforce NTP; mark events with drift flag; rerun correlation window |
| B — Collector Overload | EPS spike exceeds collector capacity | Queue depth rising, drop counters incrementing | Blind spots in key zones; missed detections | Enable disk spool; throttle non-critical sources; add regional hub; scale collectors horizontally |
| C — Parser Regression | Content update breaks field extraction | Parse success falls; fields become null | Rules misfire; false positives surge; analyst burnout | Canary deployment for parsers; rollback package; QA corpus with known-good events |