Chapter 11: Installation & Debugging
Physical installation requirements, step-by-step deployment procedures, and systematic debugging methodologies for cybersecurity monitoring systems
The physical installation and initial configuration of a cybersecurity monitoring system establishes the foundation for all subsequent operations. Errors made during installation — incorrect cable routing, improper grounding, inadequate power provisioning, or misconfigured network interfaces — can cause subtle, intermittent issues that are difficult to diagnose after the system is in production. This chapter provides comprehensive installation requirements, a structured deployment procedure, and systematic debugging methodologies for each component of the monitoring architecture.
11.1 Installation Requirements Overview
The following image illustrates the physical installation requirements for a cybersecurity monitoring appliance in a professional data center environment. Key installation elements include proper fiber optic cable routing, console cable connection for initial configuration, ESD protection, UPS power backup, and temperature/humidity monitoring. Each element plays a critical role in ensuring reliable, long-term operation of the monitoring system.
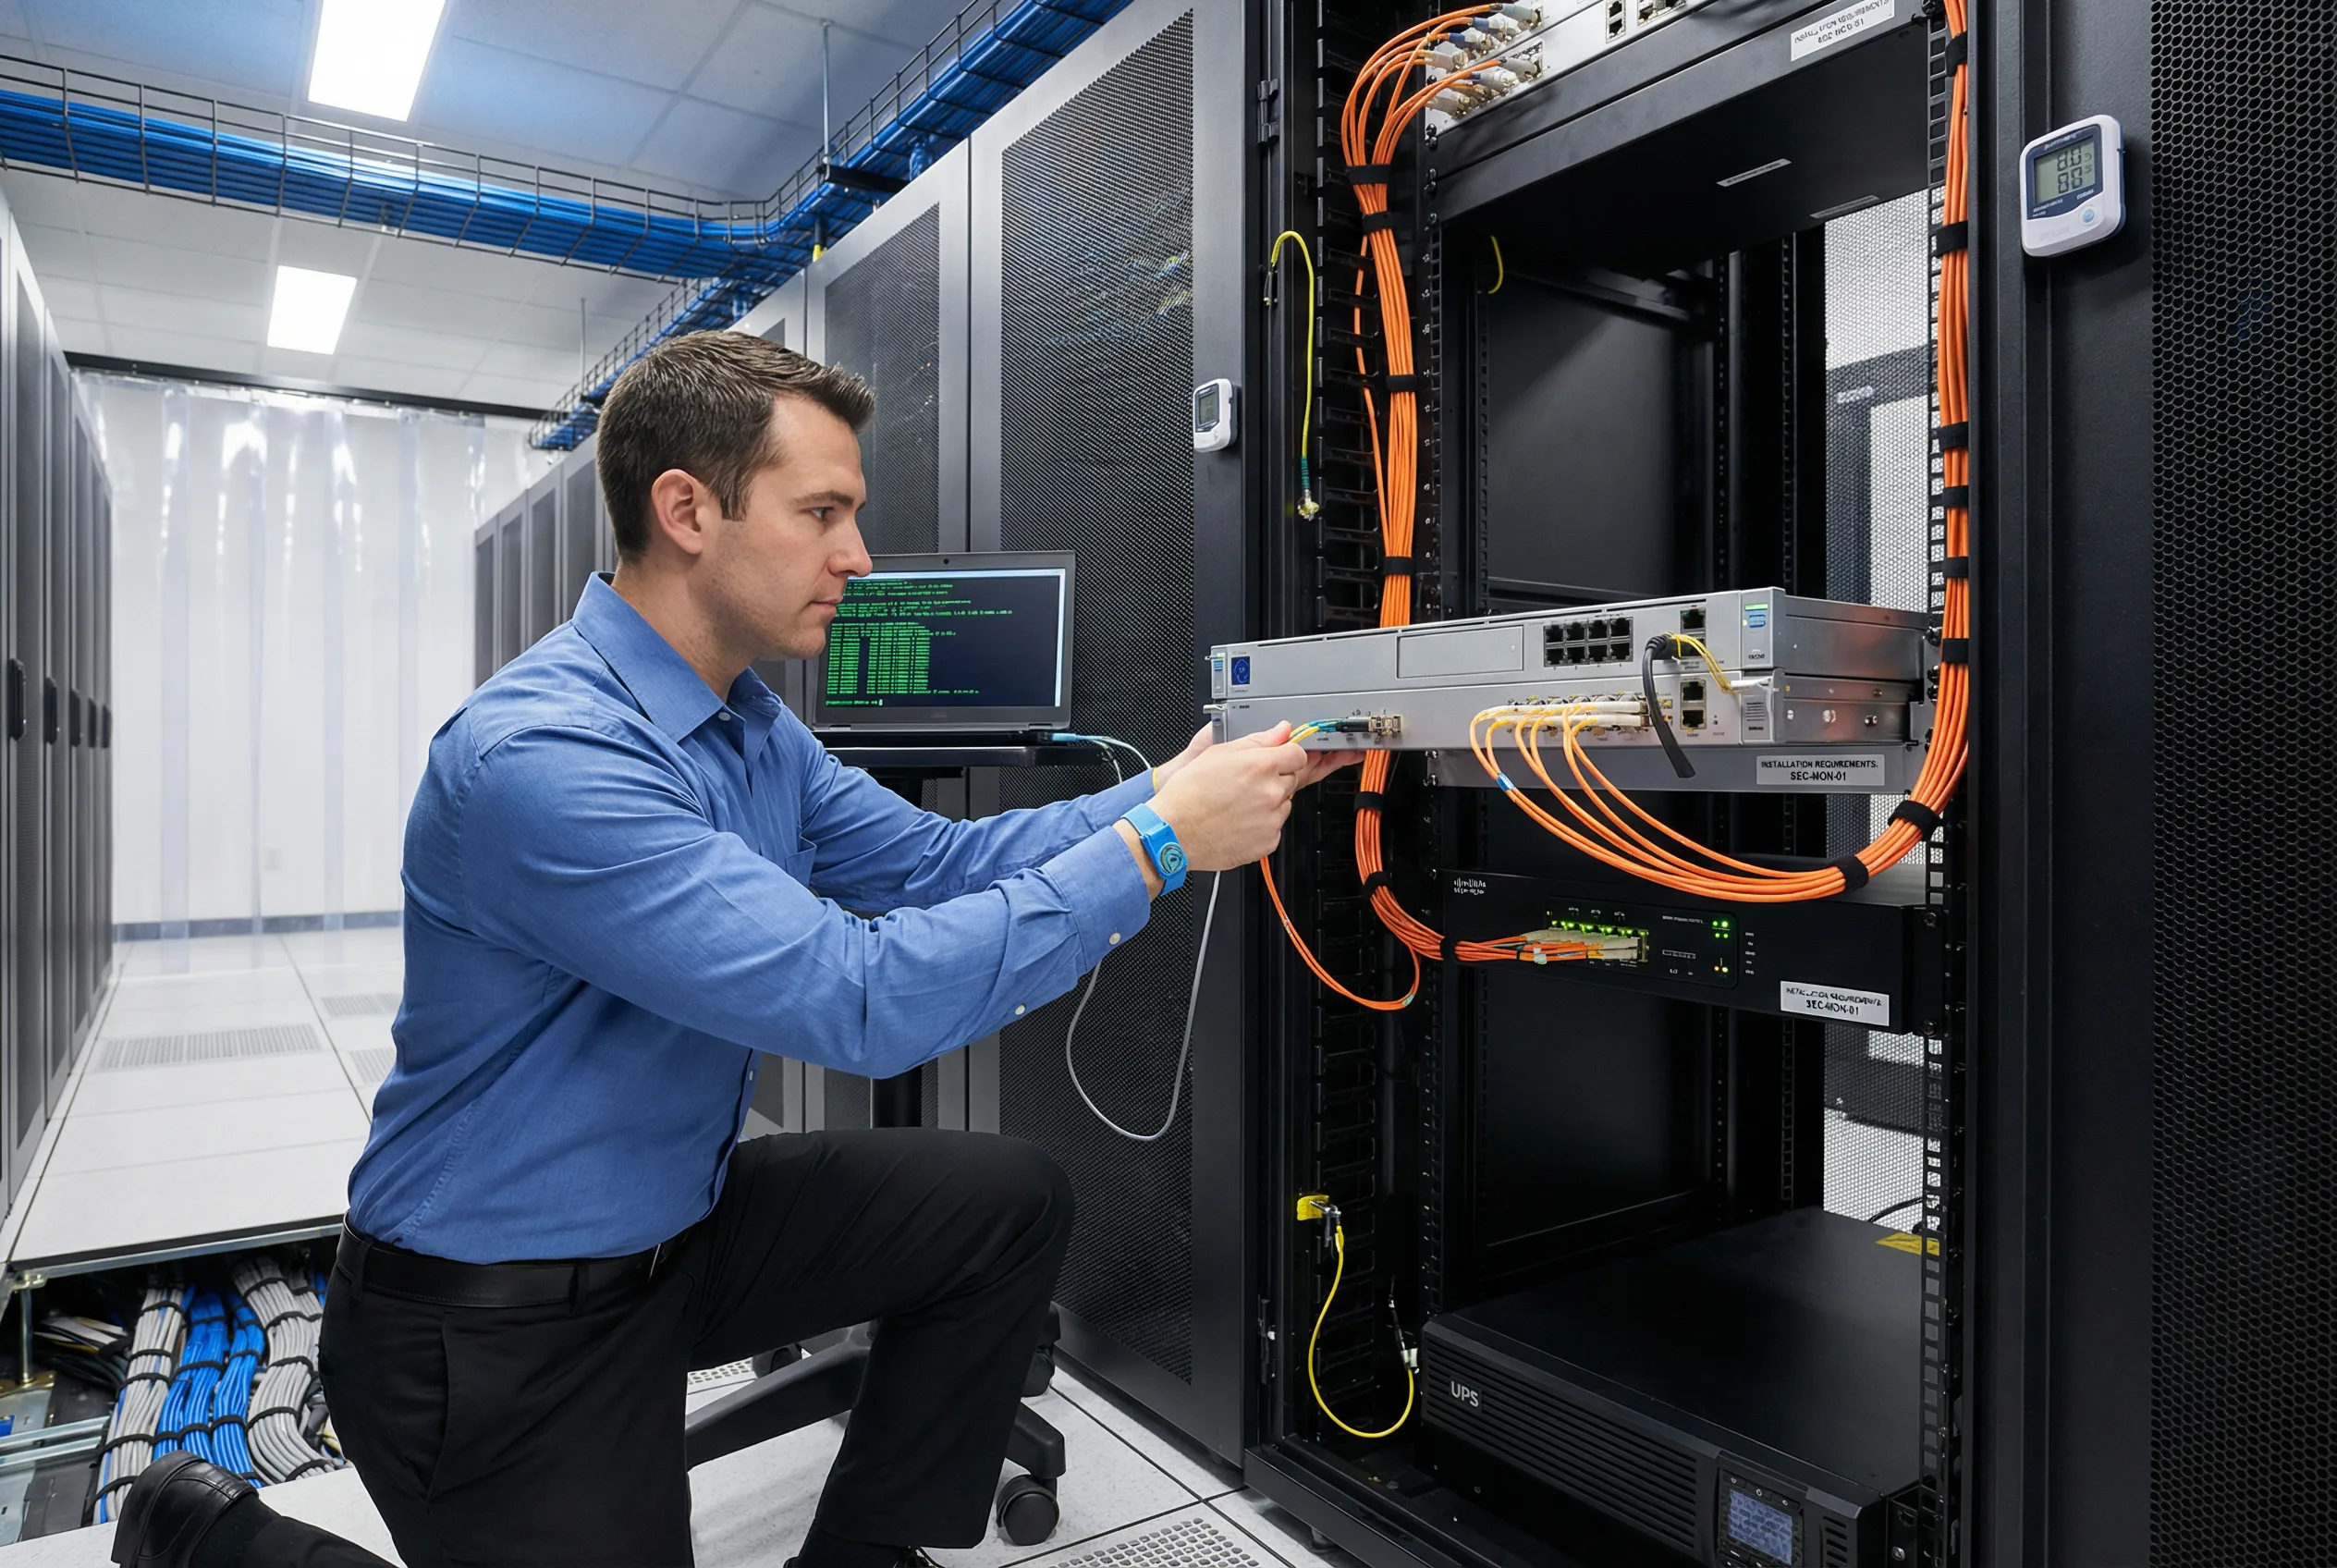
Figure 11.1: Installation Requirements — Professional installation of a cybersecurity monitoring appliance showing: fiber optic SFP+ connections, console cable for initial configuration, ESD wrist strap protection, UPS battery backup unit, temperature/humidity sensor, network TAP device in adjacent rack unit, proper cable management, and laptop with terminal configuration screen. All installation requirements must be met before powering on the appliance.
11.2 Physical Installation Requirements
Physical installation requirements must be verified before any monitoring appliance is racked and powered on. Failure to meet these requirements can result in hardware damage, unreliable operation, or voided warranties. The following table defines the mandatory physical requirements for each category of monitoring system component.
| Requirement Category | Specification | Verification Method | Mandatory |
|---|---|---|---|
| Rack Space | Minimum 2U clearance above and below each appliance for airflow; total rack load ≤80% of rated capacity | Physical measurement; rack load calculation | Yes |
| Power | Dedicated 20A circuit per appliance; redundant PDU feeds from separate circuits; UPS with ≥10-minute runtime | Electrician sign-off; UPS runtime test | Yes |
| Cooling | Inlet air temperature 18–27°C (64–80°F); humidity 40–60% RH; hot/cold aisle containment recommended | Temperature/humidity sensor readings | Yes |
| Grounding | Rack grounding to building earth ground; ESD wrist strap required during installation; anti-static mat at workstation | Ground continuity test; visual inspection | Yes |
| Network Cabling | Cat6A or better for copper connections; OM4 or OS2 fiber for optical connections; all cables labeled at both ends | Cable certification test; visual inspection | Yes |
| Management Access | Console cable connected before power-on; out-of-band management network connected; KVM access verified | Console login test before network configuration | Yes |
| Physical Security | Rack in locked cage or locked room; access log maintained; CCTV coverage of rack area | Physical security audit | Yes |
11.3 Step-by-Step Installation Procedure
The following installation procedure must be followed in sequence for each monitoring appliance. Skipping steps or performing them out of order can result in configuration errors that are difficult to diagnose after the system is in production. Each step must be documented with a timestamp and the name of the engineer who performed it.
| Step | Action | Verification | Est. Time |
|---|---|---|---|
| 1 | Verify physical requirements (power, cooling, grounding, rack space) | All physical requirement checklist items checked off | 30 min |
| 2 | Unbox and inspect appliance for shipping damage; verify serial number against purchase order | No visible damage; serial number matches PO | 15 min |
| 3 | Install rack mounting rails; slide appliance into rack; secure with cage nuts and screws | Appliance secure in rack; no movement; rails properly seated | 30 min |
| 4 | Connect console cable (RJ45 to DB9/USB); connect to laptop terminal emulator (9600 8N1) | Console prompt visible in terminal before power-on | 10 min |
| 5 | Connect management network cable (OOB management port); do NOT connect production ports yet | Management port connected; production ports disconnected | 10 min |
| 6 | Connect power cables to both PSU modules; verify PDU feeds from separate circuits | Both PSU LEDs green; UPS shows load | 10 min |
| 7 | Power on appliance; monitor console for boot sequence; verify POST passes without errors | Boot completes without errors; login prompt appears | 10 min |
| 8 | Perform initial configuration via console: hostname, management IP, default gateway, DNS, NTP | Management IP pingable; NTP synchronized; DNS resolving | 30 min |
| 9 | Apply OS hardening baseline; disable unnecessary services; configure host firewall | Hardening checklist items verified; unnecessary services stopped | 60 min |
| 10 | Install and configure monitoring application software; apply license | Application starts successfully; license valid; no error logs | 60–120 min |
| 11 | Connect production network interfaces; configure TAP or SPAN mirror ports on network devices | Traffic visible on monitoring interfaces; packet capture confirms traffic | 60 min |
| 12 | Configure log forwarding from all defined sources; verify event receipt in SIEM | All log sources visible in SIEM; event count matches expectations | 120 min |
| 13 | Execute acceptance test plan (Chapter 10); document all test results | All critical acceptance tests pass; results documented | 4–8 hrs |
| 14 | Obtain sign-off from security architect and system owner; update CMDB | Sign-off obtained; CMDB record created with all configuration details | 30 min |
11.4 Common Issues and Debugging Guide
The following debugging guide addresses the most common issues encountered during installation and initial configuration. Each issue includes a systematic diagnostic approach and resolution steps. Engineers should work through the diagnostic steps in order before escalating to vendor support.
| Issue | Symptoms | Diagnostic Steps | Resolution |
|---|---|---|---|
| Log sources not sending events | Log source visible in SIEM but EPS = 0; no events received | 1. Verify syslog configuration on source device. 2. Test connectivity: telnet/nc to collector IP:port. 3. Check firewall rules between source and collector. 4. Verify collector is listening: netstat -tlnp | Correct syslog destination IP/port; open firewall rules; restart collector service |
| High event loss rate | EPS drops; event count lower than expected; queue depth increasing | 1. Check collector CPU/memory utilization. 2. Check disk I/O on collector. 3. Check network bandwidth utilization. 4. Review collector queue depth metrics | Scale collector resources; add additional collectors; implement load balancing |
| SIEM search performance degraded | Searches timeout; dashboard load >30 seconds; high CPU on SIEM nodes | 1. Check SIEM node CPU/memory. 2. Check index health and shard distribution. 3. Review search query complexity. 4. Check disk I/O on search nodes | Add search nodes; optimize index configuration; implement query caching; add SSD storage |
| TLS certificate errors on log forwarding | Log forwarding fails with SSL handshake error; events not received | 1. Verify certificate validity: openssl s_client -connect. 2. Check certificate expiry date. 3. Verify CA chain is complete. 4. Check time synchronization (NTP) | Renew expired certificates; install complete CA chain; synchronize NTP |
| Detection rules not firing | Simulated attack events not generating alerts; rule appears active | 1. Verify events are being ingested (search for raw events). 2. Check rule field mappings match event format. 3. Test rule logic with sample events. 4. Check rule schedule and lookback window | Fix field mappings; adjust rule logic; verify event normalization; check rule schedule |